Why Gold is sending a warning, and could well be in its way to $3000/oz.
By Chinedu Okoye
Gold and Treasuries are usually negatively correlated with interest rates. However in the past 2+years of the hiking cycle, Gold has climbed consistently higher against the Greenback.
One explanation could be the Central Bank purchases experienced within the same period, the uncertainties and safety flight due to geopolitical tensions and uncertainties about the economy post covid.
Investors and Central banks hedge has kept the yellow metal afloat, up and rising. And we breakdown the metals 5 years and 1 charts, to explain where we get our insights as to why we believe the yellow metal is headed for $3000/oz. And in addition to that, sending a clear warning to the markets that the rate cuts may not provide the boost in economic activity as expected.
Gold in the past Five Years:
There has been a steady rise in the value of the yellow metal from 1535.06/oz to 2486.10. When the Fed begun it's hiking cycle in March 2022. Feds Funds Rate was raised from the 0.25% - 0.50% range, to 5.25% - 5.50% range in the second half if last year.
Gold initially came down from the near 2000/oz. range, to just above 1600 towards the end of Q3/start if Q4 2022. A textbook market reaction to the rate hikes, even as the tightening persisted and went through to the beginning of H2, 2023.
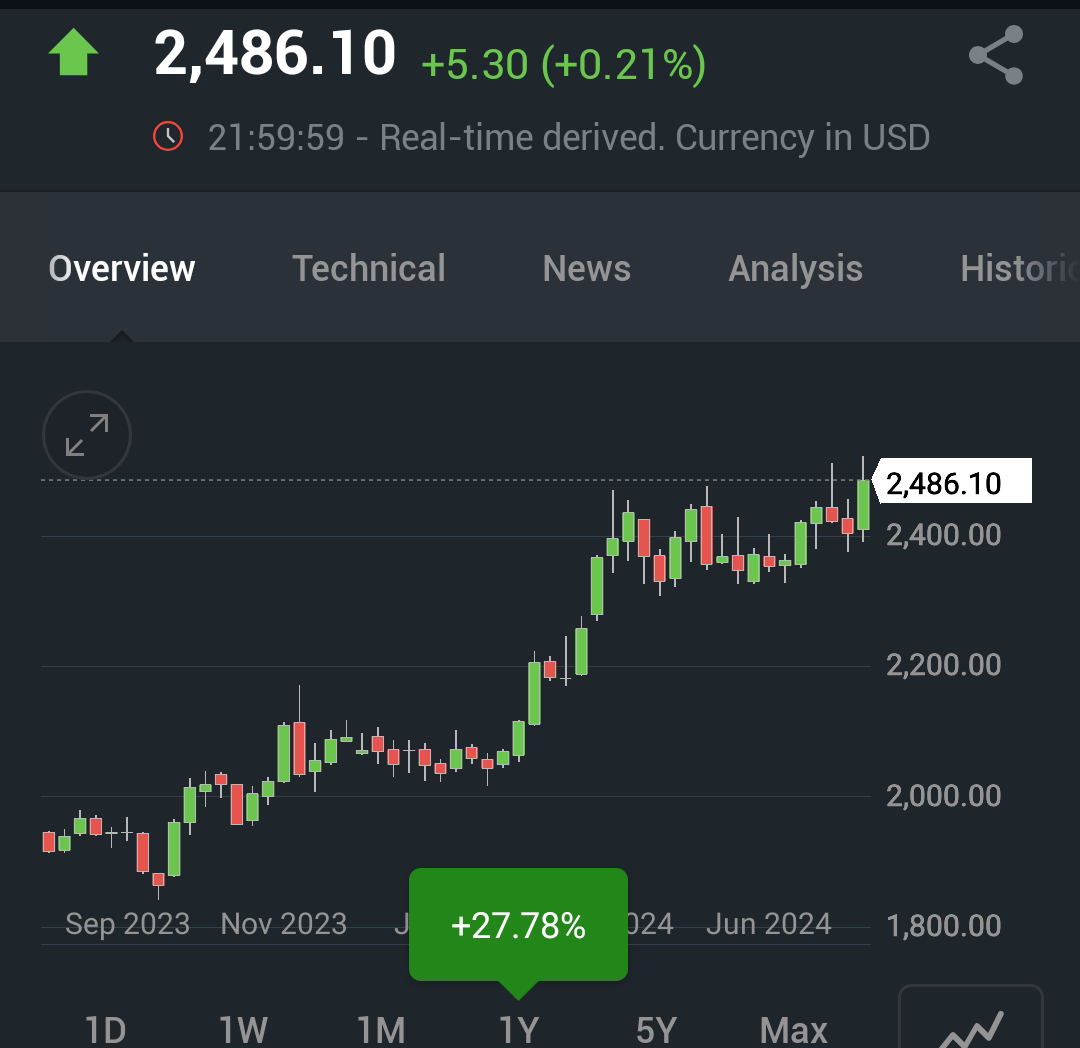
This leads to the position we hold in Gold maintaining it's climb and rising on the future. The metal has added 61.84% in the past five years and 27.78% in the past year as expectations of a cut and safety demand, and Central Bank purchases supported momentum.
(GOLD 1 year Chart)
Why Gold might continue it's Upward Trajectory:
Even though the Fed cuts could be tempered and slow, as we interpret Jerome Powell's "higher rates for longer" narrative in the past, to mean the Fed cutting at a slower pace, or at least being as data dependent in cutting as the Fed was with the hikes.
We foresee Gold hitting the $3000/$ level in H1 2023 as a sell-off in any asset class might be directly or indirectly translate to increased Gold exposure. The Fed cuts is expected to increase demand for higher yielding Emerging and even Frontier market debt, making it imperative to hedge with a reliable store of value.
Any delay in Gold hitting the projected mark will not be as a result of a sell-off or massive short of the metal. Central Bankers who have increased Gold Reserves aren't holding physical gold bars only to trade in the nearest future and the prospects for more countries in search of exchange rate stability, stocking up on Gold would further drive prices further up.
Supportive Fundamentals:
With a trillion dollar debt service bill looming and shaky employment data which supports cuts momentarily, the government doesn't have the luxury of excessive spending and consumer is not in a position to rack up spending.
The market seems to have priced in a 25 basis point cut taking the Fed Funds Rate to the 5.00%-5.25% range, an amount barely sufficient to induce discretionary consumer spending.
The risk of a re-heated economy so to speak, from even a deep 50 basis point cut is very low, and this prompts one to presume that the cut would not prevent CPI from getting to the desired 2% target range. Any drag on aggregate demand that is reflected in the inflation numbers would prompt deeper cuts giving more momentum to Gold.
The chances of a steep drop in the price of the yellow metal is very low and so traders would most likely be better off on the buy the dip strategy riding the wave upwards.
Final Remarks:
Gold provides a hedge and price appreciation gain potential to investors and could provide a cushion for any fallout of currencies of countries with significant amount gold reserves. However it remains a very speculative short term trade with enormous potential medium to long term gains.
The sustained rise in gold price could also be as a result of a slowing economy. The more capital that is allocated to gold the less available to be allocated to other asset classes. A quick climb to $3000/$ could well be indicative of a slow down in global economic activity.


Comments
Post a Comment