Zero Equilibrium H1 2025 Financial Market Review
- By Chinedu Okoye
ABSTRACT:
This paper reviews the performance of key financial markets and select asset classes in H1 2025, building on prior outlooks published in our Zero Equilibrium series. We assess how equities, fixed income (sovereigns), commodities, and crypto fared relative to our expectations, noting where outcomes aligned or diverged (especially in light of unpriced geopolitical tensions and trade policy uncertainty).
Equities proved more volatile than anticipated, with sharp swings tied to tariff news, but ultimately recovered on the announcement or a pause, while gold and silver hit our targets on safe-haven flows and central bank reserve shifts.
Oil struggled under weak Chinese demand, though it hit our expected range. EM sovereigns delivered on their risk-reward potential, and crypto (led by Bitcoin) performed in line with expectations, showing both high volatility and upside. This paper reconciles our broad macro views with actual market behavior and sets the tone for our H2 positioning.
1.0 Introduction
This paper is pursuant to prior financial markets (and select aset classes) outlook published for the year, and the review and outlook presented on our paper Zero Equilibrium Q1 Financial Markets Review and Q2 Expectations after Q1. Where we made macro-based analysis, commenting on performance outlooks for; Fixed Income (Sovereigns for developed and EM by proxy); Equties (Indexes); Commodities; and Crypto.
Assets on our watchlist and portfolios consist of the aforementioned and narrowed down to;
- Major Indexes: US, European, and a select EM countries namely China (Shangha), India (Nifty), South Korea (KOSPI)
- Commodities: Gold, Oil
- Crypto: Bitcoin, PAXG, XAUT, BCH,
- Fixed Income Sovereigns:
- Developed Markets: US 10 year, UK 10Y; Germany 10Y; SPDR Bloomberg EM
We made macro-based outlook and review absent the geopolitical crisis and US international trade hostilities, and in this paper we aim to reconcile our informed broadbased expectations to the actual peformance of said assets classes and financial instruments, in hindsight.
Section 2.0 gives a summary of conclusions reached in the prior papers on financial markets outlooks and predictions, in the 2025 (H2) outlook and in the Q1 Review which also provides a Q2 revised outlook.
In 3.0 we provide context behind any accuracy or miss in price rather and performance expectations, explaining the fundamentals behind it, and in section 4.0 a review of our holdings in the crypto space is presented.
2.0 Re: H1 Outlook:
2.1 Equties:
In our outlook and Q1 Review we opined that equities are expected to be the least volatile and/or at most stable amongst all other assets classes.

From the above chart, we can observe wild swings born out of tariff or trade policy uncertainty which took the Dow to as low as $38,000, before a sharp rebound to$44,051.08 as at June 30, the last trading day of the first half of 2021.

From chart 2 above it is evident that the S&P 500 has also mirrored the same movement, as did the NASDAQ (see chart 3 below), suggesting that the downswing was solely due to the tariff uncertainty.

All these major indexes have since rebounded to levels higher than their January levels, as fears were somewhat alleviated with the 90-day pause on all additional tariffs. Confidence returned to the markets, the invalidating our expectations of equities being the least volatile is purely based on tarrifs. This is evident in the rebound seen after April 2nd.
So despite the unforseen turbulence witnessed in the Dow Jones, S&P, NASDAQ, FTSE 100, DAX, equities in these markets have rebounded from earlier lows/dips to record positive gains month-to-month and in the half year.
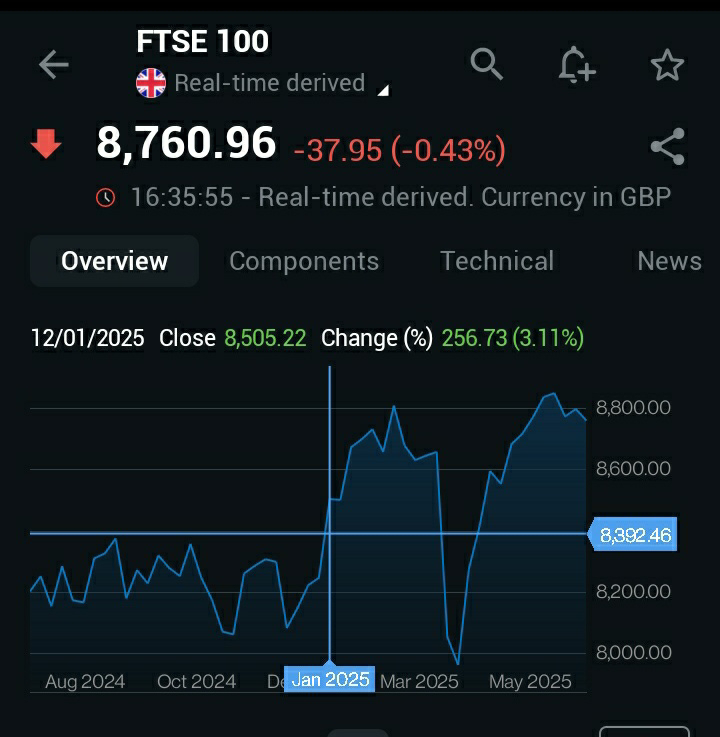
From the above, the FTSE 100 also experienced a similar move, which is unsurprising given the exposure of UK businesses to the US. The DAX also experienced a similar move, to record an overall H1 positive net returns.

In Asia, our focus has been on Japan, China, India and South Korea. The Japanese stock market Nikkei, was more volatile the first half of the year than its European counterparts, but ended H1 on a net positive.
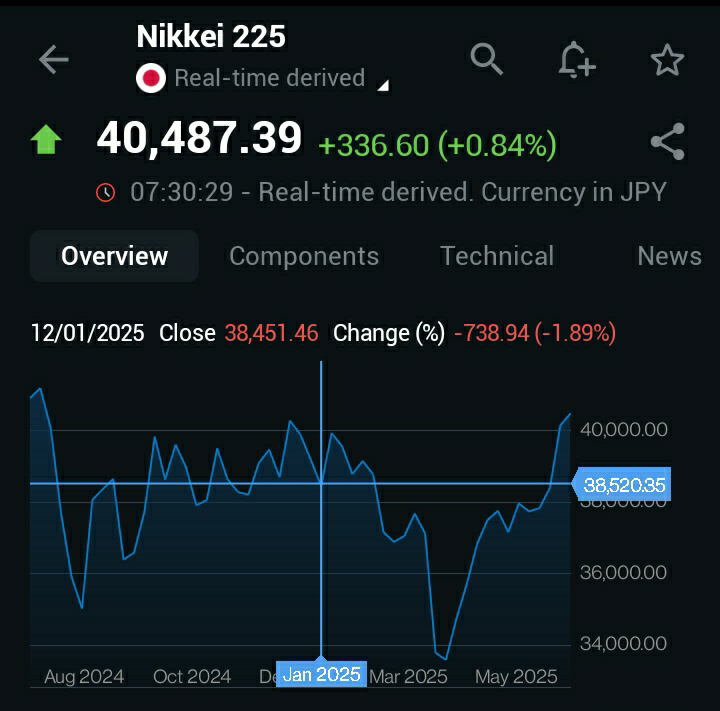
(Chart 6; Nikkei 225)
In China, the story has been am upward slope, owing to ultra loose monetary policy, which has spurred investments in the stock market.
The largest disruption to the equity markets is the political environment and uncertainty about trade.

(Chart 7: Shanghai SSEC)
2.2 Commodities (Gold, Oil, Silver, Natural Gas):
The commodity segment (based on our interests) have shown a mixed performance with gold and silver hitting H1 targets and oil struggling above $70
Precious metals (Gold and Silver) have outperformed all other commodity segments over the last couple of years. Crude oil though have been on a rollercoaster ride, but supported by a weaker dollar and U.S. supply constraints.
2.21 Gold: Has reachedour H1 target of $3,300 on our outlook to close at $3,319.35, as the safe haven appeal —in light of the trade war and geopolitical tensions in the Middle East —and central bank reserve diversification (out of the USD into gold) increases.
The yellow metal is now poised to hit out full year price target of $3,600
 (Chart 8: Gold Spot)
2.22 Silver: Silver has seen a ~12% rise in the first had the year, begining at $31.863 at the beginning of the year to $35.955.

(Chart 9; Silver)
2.23 Natural Gas:
This is the least performing commodity on our watchlist having trade sideways during the first half of the year. But gas was above $3.600 for the most part of the years half, but closed at $3.439, up from 3.392 on January.

(Chart 10; Natural Gas)
2.24 Oil:
For Oil the target was $73 and $75 for WTI and BRENT respectively. Though prices surged to those highs and beyond for both benchmarks, earlier in the year, it was accompanied by a sharp rebound as well. To the $60s level.
 (Chart 11: BRENT Oil)
The commodity came under pressure with tepid demand our of China (which gets a bulk of its Crude from Russia and Iran–prior to the war). The expected volume replacement out of Iraq, and Jordan has kept crude below $70. BRENT closed the second quarter at $66.63, and US Crude $64.98.

(Chart 12: U.S. Crude)
3.0 Fixed Income (Sovereigns):
Emerging Market sovereigns, we said, provides the best risk-reward balance whilst developed markets possessed price appreciation potential.
 (Chart 13: SPDR Barclays Emergening Markets Bond ETF)
The case of EM sovereigns (via our proxy asset SPDR Barclays Emergening Markets Bond ETF) has proven to be true as seen in chart 13 above.
U.S. ten years stay flat at 4.223% from 4.246 in January. This is not entirely contrary to what we expected for the first half (yields and bond prices have an inverse relationship) of the year but it is noteworthy to mention that we saw a move to safety with the downward sing in April after the Trump administration announced tariffs.

The U.K. ten year is down from near 4.8% in January, to 4.4830% as at the last say of Q2. This falls in line with our expectations for developed market sovereigns price appreciation expectations —yields dipping 37 basis points have an opposite [increase] effect on prices.

Germany 10 Year
This is the one Developed market sovereign that defies our expectations for the DM fixed income segment.

4.0 Cryptocurrency:
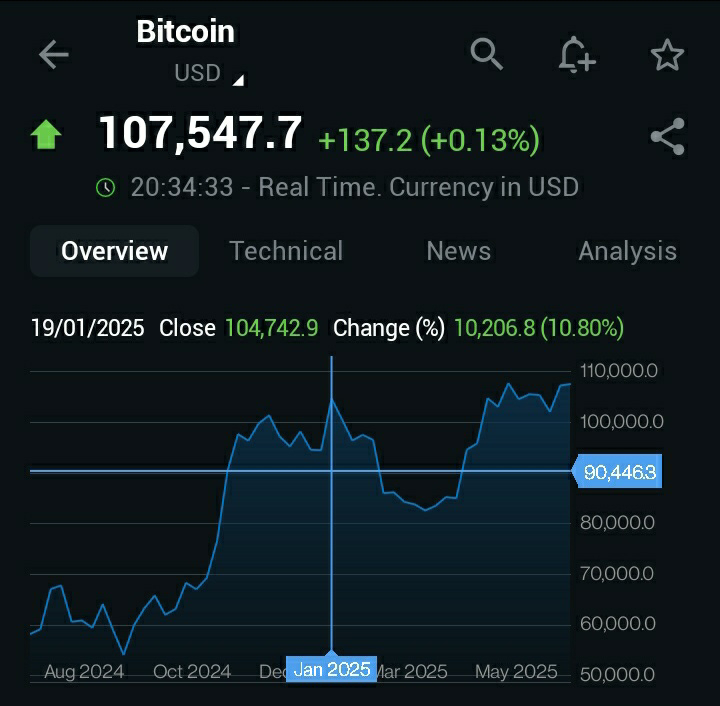
This we expected to be the most volatile asset class with the most upside potential. This has held given the swings in the crypto assets in our portfolio. Bitcoin has swung down to the $80,000 levels and then rebounded to close Q2 at $107,547
Pax Gold (PAXG) and Tether Gold (XAUT) expectedly consistently mirrored Gold's price movements.

(Chart 15: PAXG)
From chart 15 above Pax Gold closed at $3,314, and Tether Gold ended H1 at $3,312.50 (see chart 16 below). Both Bitcoin and the gold-backed cryptos behaved in the expected manner, with Bitcoin rising higher despite wild swings and PAXG and XAUT riding a smooth steady upward movement in line with the metal it is backed by –Gold.

(Chart 16; XAUT)
The above was expected as per our 2025 Outlook we stated that: "Gold-backed cryptocurrencies (e.g., PAXG, XAUT) may offer stability amid the sector’s inherent turbulence, appealing to risk-averse investors. They also offer a chance to diversify ones crypto portfolio." These coins have lived up to those expectations providing decent returns and stability [to crypto portfolios] throughput the years half.
5.0 H2 Outlook: Remarks and Expectations
Gold is expected to hold gains and move further up on the next half of ur excellent yesterday with a price of $3,600. Silver should follow suit in the precious metals space and a $40 silver is the baseline expectations for FY 2025.
Oil will most likely hold at the $60 level but an upward trend is not rules our and we stay bullish on that.
Equities: As Q3 begins today, with the tariff pause barely a week to the end of its deadline and with no visible deals in sight, our expectations for equity markets is tied to the possibilities of a comprehensive trade agreement between the two largest economies in the world (United States and China).
Fixed Income Sovereigns remain the safest bet after precious metals in terms of stability with more upside (returns) expected in the EM space –given the expectations of a weaker dollar, which also makes DM sovereigns —specifically Treasuries —hold price appreciation potential.
The Crypto space (assets we hold as stated above) will continue to be dominated by Bitcoin and it's price direction determined by perceived market (risk) sentiments. Volatility in this space is given but it still holds the most upside potential.
A sustained trade dispute/ uncertainty and an economic recession would take equities, Crypto (Bitcoin and others), and Oil down, but will be bullish for Gold and Treasuries as we expect the inverse relationship between stocks and bonds to be reinstated in the markets, especially if central banks and particularly the Fed rune extremely dovish.


Comments
Post a Comment